Google Search + Shopping Q3 2021 Performance Retail Data Summary
Share:
After the explosive ecommerce growth that we saw heading into the holiday season in 2020, retail advertisers are taking full advantage of a digital-first business model to capture the continued surge in online shopping while adapting to changes in consumer shopping behavior. No channel is more aligned to overall consumer and advertiser sentiment as search is. It’s an intent-driven media that we predominantly manage based on a target return for our clients.
This performance advertising data summary provides spend, cost, and click trends for Google paid search and shopping ads across Adlucent’s advertising clients.
YoY Clicks Accelerate for Google Search and Shopping. Spend Declines. CPCs Remain Elevated.
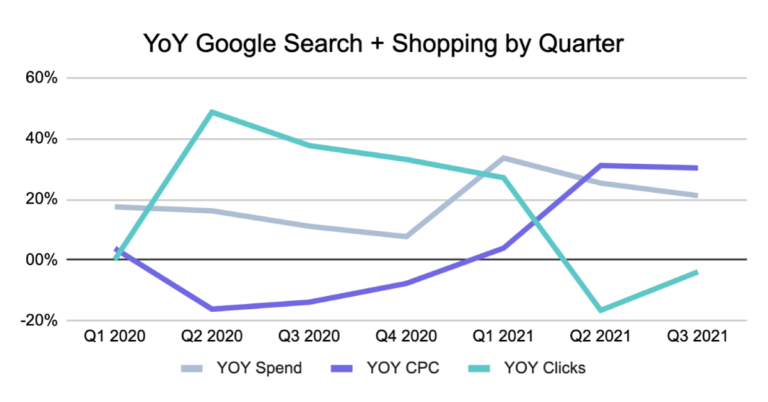
In Q3 2021, we saw an acceleration in average clicks as the year-over-year (YoY) click growth went from -16% in Q2 to just under -4% in Q3 2021. Although this represents a decrease in YoY clicks for each of the past two quarters, we’re comparing these metrics against the astronomical increases of Q2 and Q3 2020, when the increased clicks were driven largely by more time spent at home and the distribution of stimulus checks that had incentivized consumer spending.
Year-over-year spend by the average advertiser decelerated slightly from 25% growth in Q2 to 21% growth in Q3.
One of the biggest stories in paid search marketing and digital advertising right now is the ever-increasing cost of acquisition. Paid search is no different, as we’re seeing cost-per-click (CPC) maintain its elevated YoY growth, coming in at 30% over the same quarter last year. However intimidating this number sounds, we need to make sure that we’re looking at the full context of these increases.
The 30% CPC increases in Q2 and Q3 respectively are compared against two-quarters last year, where we saw some of the first CPC declines in a long time. Advertisers had paused campaigns and stepped away from the auction due to concerns around the uncertainty of the pandemic. Importantly for shopping, which makes up nearly 80%+ of digital media spend for several of our retailers, Amazon also dropped out of many, if not all, of the auctions due to supply chain issues and focus on their fulfillment of essential items.
So, how do we better gauge the relative CPC increases we’ve seen? When we look at the total increase in CPCs over the past two years and compare Q3 2021 to a pre-pandemic Q3 2019, we only see CPC increases come in around 12% over those two years. While little to no CPC increase would be preferred, looking at the data from the perspective of a 6% annual growth rate is much more palatable than some of the YoY numbers we see when comparing 2021 to a very a-typical 2020. 2020 was a standout year, as we all probably already know, and we need to make sure we continue to look at the big picture as we evaluate the context to understand what it means for Q4.
YoY Click and Spend Growth Increase for Google Search and Shopping at the End of Q3
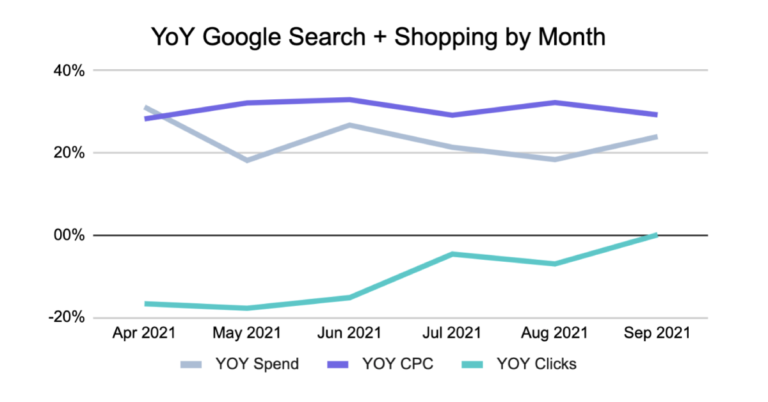
When we zoom in on the months leading into Q3 2021, and throughout the quarter, we see a generally steady rise in clicks. This increase is potentially tied to the opening of stores that were focused on driving digital traffic and Back-to-School shopping, as more students prepared physically go to classes. As we move from Back-to-School into a holiday shopping season, the increasing clicks may also indicate holiday shoppers who are heeding the advice of news outlets everywhere to “shop early” to avoid potential shipping and supply chain challenges later in the season.
As for CPCs, we see them remain consistently elevated across the quarter. However, we’re again looking at CPCs in September 2021, showing 30% higher than the still-suppressed CPCs of September 2020. When we step back and look at the longer-range context, we see that our average CPCs of September 2021, while accelerating, is only 14% higher than a pre-COVID September 2019, so a much more gradual increase over the two-year period.
YOY CPC Swings Not as Severe on Mobile
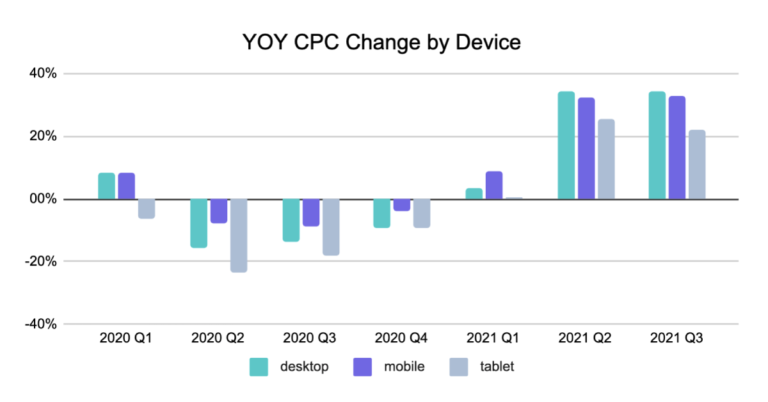
When we look at the YoY CPC growth by device over the last seven quarters, we observe nearly the same trends across all the devices in the overall CPC figures. One trend we do see is the total decline in mobile CPC last Q2 and Q3 was lower than the drop we saw in desktop CPC over the same time period. So, we’ve seen a bit less of an increase in mobile CPCs for Q2 and Q3 2021 since we’re comparing it to a slightly more modest decline in mobile CPCs in the same period in 2020.
Spend & Click Distribution by Device
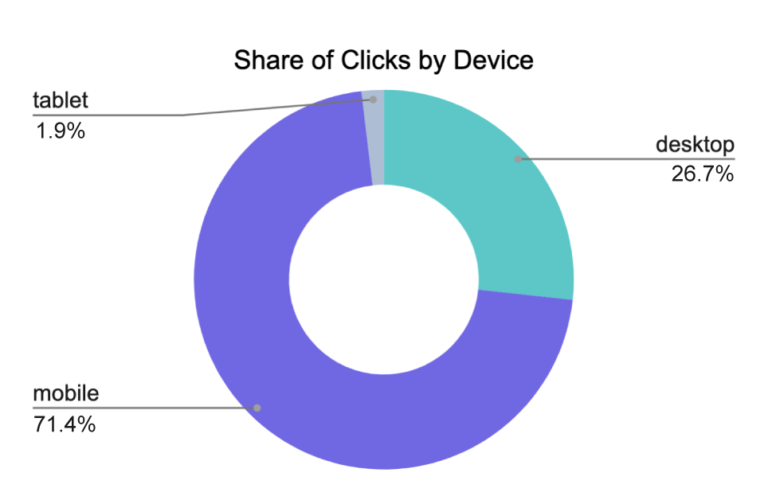
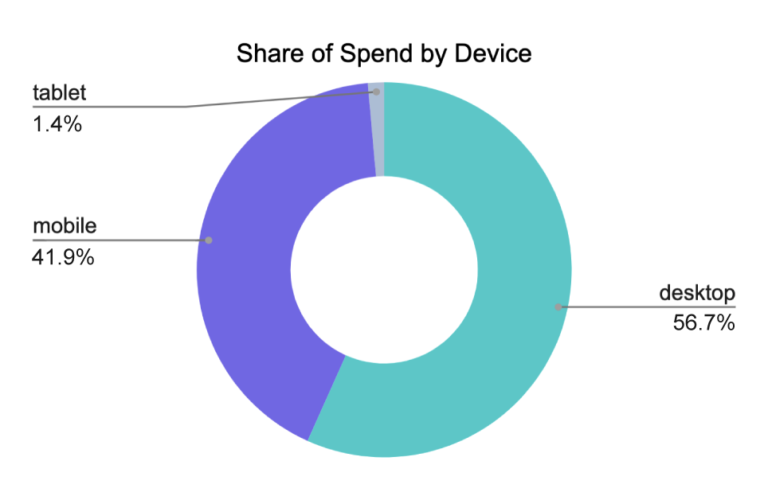
Looking at the comparison between the share of clicks and the share of spend by device types in Q3, the disparity between CPCs across devices becomes more apparent. Consumers are back to spending a significant amount of time on mobile devices as they’re back to moving around and being more, well, mobile. Mobile clicks drove over 71% of our total search clicks on Google in Q3.
However, there’s still an imbalance in the CPCs we see. Desktop drives over 56% of the spend, but the CPCs for that device remain much higher. Several factors influence higher desktop CPCs. Some include:
- Generally, higher conversion rates for desktop as the form factor lends consumers to be more purpose-driven in their shopping actions.
- More direct conversion attribution between a click and purchase happens on desktop vs. connecting a mobile click to an offline (in-store) conversion.
- A different product mix on mobile as local inventory ads (LIA), Local Campaigns, and other local ad formats tend to be more front-and-center in the mobile search results page. These local formats don’t include the competitive factor of Amazon in their CPC pricing.
What Do These Q3 Trends Mean for Q4?
- Expect CPCs to continue to remain elevated. Most advertisers are back in the marketplace at this point, looking to capture consumer sales dollars. And that competition should be strong. JLL is reporting that shoppers plan to spend 25% per person this year and eMarketer expects sales to increase by 9% this holiday period in the US. This research highlights how consumers are likely to be back in person, for both shopping and social events. Not to mention, there is likely “pent-up” demand for spoiling those that we see in-person compounded by additional savings that could potentially still be padding shoppers’ bank accounts from the prior stimulus check.
- Consumers will be shopping earlier. We’ve consistently seen shopping behavior pulled earlier and earlier in the last several holiday seasons. 2020 was the earliest shopping season yet. Led by Amazon Prime Days in October and retailers putting Black Friday-like offers in the market earlier and throughout the season to prevent shoppers from crowding stores. This year, we’re already seeing Black Friday-like offers being released from the likes of Walmart, Amazon, Home Depot, and others. Some of the ramp-up of clicks that we’re seeing in September could be leading to those early purchases in October. The early deals, compounded by the constant barrage of news that supply chains and shipping challenges may cause problems for gift shoppers late in the season, will drive buyers to shop earlier this holiday.
- Brick and mortar retailers should take advantage of in-store shoppers. Retailers with brick and mortar presence will need to focus on a mobile digital-to-store connection to take advantage of consumers willing to shop in-store. Consumers will likely seek products in stock “near me” when they’re not available or not available to ship online. The added opportunity for brick-and-mortar retailers to play in a local space not dominated by Amazon (i.e., LIAs and Local Campaigns) should be worth the effort.
Hopefully, this data sheds some light on trends and provides insights on what to expect for your search engine marketing in Q4. Retailers should see shoppers taking advantage of holiday deals now, so ensure that your products and offers are easily visible to consumers, so you’re part of their holiday gifting list.
Methodology for Our Data Summary
Adlucent manages over $1 billion in performance media spend across over 100 clients. Named by Google as their largest U.S. agency partner for shopping ads investment, we have a unique opportunity to share insights and observations into the behaviors of the engines and consumers.
To establish a fair baseline to assess the changes in performance, we only selected clients who have worked with Adlucent for at least nine quarters, which gives us a solid base of advertisers, predominantly retailers, who have been with us since Q2 of 2019. We also excluded any advertisers who didn’t meet a minimum spend threshold or seemed to dramatically change their strategic objectives throughout the evaluation period. The graphs and charts above represent the average advertiser for the time period listed unless otherwise noted.
Adlucent is the performance marketing agency built for no-limit breakthroughs. Contact us for help with your paid search, social, display, and retail media campaigns.

Ryan Gibson
Ryan is VP of Strategy at Adlucent. He has over 15 years experience working with digital and multi-channel marketers to drive better results from their programs. His perspectives of online marketing are based on analyzing data-driven insights from an array of advertisers - from enterprise to start ups - as they capitalized on customer-centric, full-funnel programs across search, social, shopping and digital media.
More Resources
Blog Post
October 9, 2024
10 Holiday Stats Every Retail Marketer Should Know
Discover 10 essential holiday shopping stats for retail marketers in 2024. Learn how to boost your campaigns with insights on omnichannel strategies, video ads, BNPL, and more."
Blog Post
September 5, 2024
Adlucent Awarded Google Marketing Platform Certified Partner Status, Strengthening Client Solutions
Adlucent, the performance media, analytics, and data agency that recently joined forces with BarkleyOKRP, is officially a Google Marketing Platform (GMP) Certified Partner for Display & Video 360 (DV360), Campaign Manager 360 (CM360), and Search Ads 360 (SA360).
Blog Post
August 28, 2024
The FTC’s Crackdown on Surveillance Pricing: What You Need to Know
Explore the controversial rise of surveillance pricing and the FTC's investigation into its implications for fairness and consumer trust. Understand how personalized pricing impacts retail competition.